August 28, 2003
What Nightmare may Come?
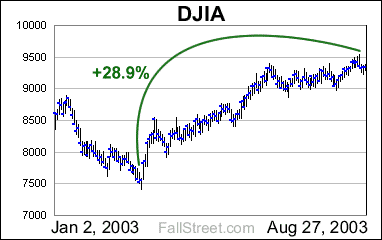
On August 22, 2003 the Dow Jones Industrial Average hit an intraday high of 9535. If recent history is any indication, expect the DJIA to be trading near 8,000 sometime before the end of October.
At first glance, speculating that the Dow is about to slide by more than 1,000 points may seem absurd. After all, the U.S. economy seems to be improving, and so long as Fannie/Freddie doesn’t blow-up and Greenspan lives, the case for a meltdown simply isn’t apparent. However, in each of the last 6-years - 5 of which have technically been ‘expansion’ years – the Dow has fallen by double digits from its August intraday high in September/October. And while 6-years hardly a trend makes, it is worth remembering that even during the mania years – 1996-1999 – there is usually a better opportunity to buy the Dow in Sept/Oct than in August.
* On September 3, 1996 – months before Greenspan would utter ‘irrational exuberance’ - the Dow hit an intraday low of 5550 (lower than any close in August).
* In 1998, with the global financial markets reeling because of the Asian Flu and LTCM uncertainty, the U.S. stock markets entered September on a weak note (losing 4.19%, 1.4%, and 6.37% in the final three days of August respectively). And even though the Fed reacted promptly and capital funneled into America, the Dow still swooned in October (-17.3% from its August peak) before taking off later in the year.
* Trading at 11,428 on August 25, 1999 – amidst the greatest mania ever and only months before the Dow would reach all-time highs – the Dow hit a wall. 37 sessions and more than 1,500 lost points later, the Dow would hobble into the last week of October down more than 13% from its August peak. In hindsight, this correction turned out to be nothing more than a short term ‘buy the dips’ opportunity – operative word being dip.
Expect a Dip -- But Will The Dump be Delayed?
With September historically the worst month for stocks and October synonymous with the word ‘crash’, the case can be made that - after more than a 2,000 point run-up – the Dow will trade significantly lower than its August peak (set just 4 sessions ago). Averaging out the last 7-years, the Dow can be seen losing 15.7%, which brings the average down to the 8,037 (Excel).
|
|||||||||||||||||||||||||||||||||||||||||||||||||||||||||||||||||||||||
That said, whether or not an expected dip in the coming months turns into something worse could depend on the unexpected: whether or not the bond market upheaval threatens to leave more damage in its wake, whether or not the refi shortfall sparked by rising mortgage rates immediately impacts consumer spending, and whether or not the dip turns into a self feeding dump...
In July 2002 the U.S. stock markets were collapsing as market participants feared that a Brazilian default loomed. However, soon after the U.S. (IMF) bailed out Brazil the stock markets bottomed and began to rally with authority. As the markets roared ahead - on August 22, 2002 the DJIA hit an intraday high of 9129 versus a low of 7489 on July 24 (+21.9%) – the bears were mauled. Yet, as the ‘new lows’ in October 2002 showed, the bears would have their revenge.
Fast forward to today: instead of rallying off a July bottom (as was the case in 2002), the markets are rallying from a March 2003 bottom. Are bear’s finally about to exact revenge? We will soon find out, as investors have become increasingly complacent, valuations remain rich, and the long awaited dip may be upon us.
 |
a