Company Watch   - Tidewater (TDW)                                October 17, 2002

Overview

Tidewater Inc. provides marine services to the offshore energy industry by way of its 550+ vessels. The company has 6 public competitors, 1 main private competitor, and countless other smaller competitors. Its revenue breakdown is roughly 70% international and 30% domestic (primarily in the Gulf of Mexico, or GOM).  

Tidewater is a competitive company primarily because of its economies of scale, and it is an attractive company primarily because of its clean balance sheet and regular dividend payments. Moreover, and although cleaner burning fuels and/or ‘green’ energy is clearly the future, natural gas and oil consumption is hardly at threat of declining significantly for the foreseeable future. As such, while Tidewater does have a finite, albeit probably lengthy, lease on life, the company can be expected to grow in step with oil and gas consumption and/or the global economy.

Although we are not recommending Tidewater shares at current levels, we have rounded out our investment opinions on the company: Tidewater is an attractive company based upon its fundamentals.  We would recommend reevaluating the company in the future should its stock price become more attractive.

This report is divided into 3 sections:

1) Introduction
2) Overview of Tidewater’s position as a leading oil services company.  
3) Investment opinions for Tidewater.

Part I Introduction

Feast or Famine For Oil (Marine) Services Companies

Offshore rig counts tend to creep higher when demand for oil and natural gas is rising.  By contrast, when demand for product is weakening and/or it is not considered advantageous for companies to enact new development projects, oil services stocks tend to falter as rig counts decline. However, these generalities are hardly absolute. To be sure, a dramatic rise in oil/gas prices could potentially trigger economic weakness, which by itself could prelude a drop-off in end user demand. Suffice it to say, determining the future price of oil based upon demand, inventory levels, and geopolitical influences, is a demanding task.

That said, tracking the specific action for oil services stocks can be done in many ways. To begin with, the investor must consider rates of utilization, which vary due to both supply/demand factors and/or seasonal trends.  The basic point here is that higher rates of utilization signal better rates of profitability. Additional considerations related to utilization rates are daily vessel rates, rig counts and energy prices. Combined these factors determine what the industry utilization rates are.

For specific company utilization rates, it is necessary to look at a company’s vessel replenishment rates and vessel attrition.  As a fleet grows older capital expenditures loom for new ships. By contrast, as a fleet grows in size profitability can be improved without having to increase overall rates of utilization. Indeed, the utilization/vessel rates conundrum carries with it many considerations.

Given that offshore rig activity is generally cyclical, or dependant upon peaks and troughs in energy prices, the investor comes to understand that companies are constantly in search of, but rarely find, a point of equilibrium in terms of their utilization of vessels. Specifically, oil services companies are either adding more capacity or they are actively seeking to reduce capacity – the outlook is never fixed (save for the acquiring of long term charter contracts (which few companies solely employ)).

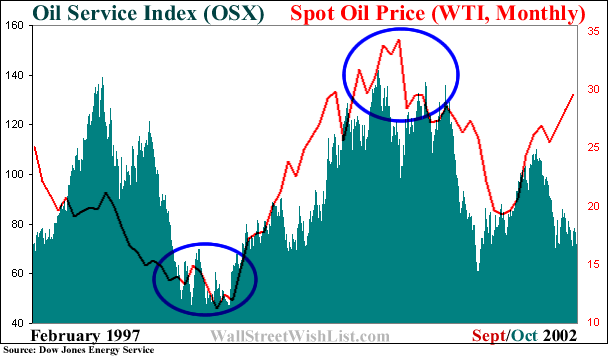
Historically speaking, investors are willing to pay the highest premiums for oil service stocks at the height of the feast and the lowest premiums at the lowest point of the famine. To be sure, possessing basic contrarianism is to the investor’s advantage when attempting to judge the market’s direction near term, as the recent performance of the OSX versus the price of oil suggests.

Although hardly an absolute, what the above chart does tell the investor is that oil prices can act to immediately impact OSX companies’ share prices even though a rising or falling oil price takes time to impact overall rig counts. Suffice it to say, despite the fundamental lag between say rising oil and rising OSX corporate profitability, the investor perceptions are what control the market in the near term.

With the feast and famine perceptual investment model in mind, oil services companies tend to trade in a volatile manner -- more volatile than say regulated utilities or the more predictable pipelines, yet not as volatile as exploration driven companies which can suffer heavy losses during times of famine.

Current Situation

Baker Hughes rig counts are currently below historical norms (727 versus 736 average for the last decade). And while offshore rig counts are actually higher than their decade average, ODS-Petrodata’s utilization numbers are telling of weakness: the fleet utilization rate of offshore platform rigs in the GOM stands at 36.1% (as of June 02).  Likewise, ODS-Petrodata reports that the percentage of offshore contracted rigs being utilized out of the total competitive fleet supply is mired near multi-year lows (85% for floating rigs versus 80% for Semisubmersible rigs worldwide).  There is some strength in North Sea day rates, and utilization rates for deepwater vessels continue to be significantly higher than for others (crew boats, tug, towing and supply).  Nevertheless, the overall industry fundamentals for marine service companies are weak.

However, with oil and natural gas prices having risen in recent months there is the expectation that rig counts will rise and service companies will attain higher day rates and/or a more favorable operating environment. Given that Tidewater warned that they will miss their latest earnings estimates and their price rose, these expectations would appear to be baked into current equity prices.  That marine service companies in general have formed proverbial ‘bottoms’ before any true strength in vessel rates or rig counts materializes is not surprising.  Again, it is the perception that investors have on the future that makes the difference. All that needs to be said to surmise the current atmosphere is that energy prices have risen.

In sum, the disconnect between current fundamentals and expected fundaments ensures that oil service stocks will remain volatile.

Mapping Industry Volatility

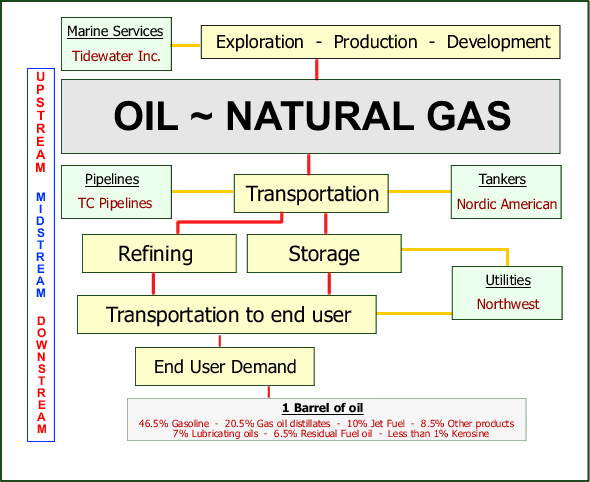
To lend a hand in deciphering what we mean by ‘volatile’ we have a basic schematic of the companies involved in the oil/natural gas industry. This basic chart depicts many of the ‘niche’ companies we have previously focused on.

To note: many participants deal in more than one facet, and the chart is limited in this regard. Nevertheless, for our main purpose, which is highlighting Tidewater Inc., the chart serves to illuminate some of the considerations the investor should make with respect to the broader industry.

As an example of the utility of this chart, consider the status of those companies listed within it. Northwest’s  customer growth rates are slumping and industrial growth is declining.  Nordic American is chartered until September 2004, but the threat of entering an extremely weak spot chartered tanker market looms. Finally, TC Pipelines is doing well because of its long term contracts, but actual pipeline throughput has been weak for much of 2002.  The point is this: weakness or strength in midstream and downstream companies can be a signal of weakness or strength in upstream companies.

Although not an absolute guide, understanding the different roles and fundamentals of multiple niche companies that focus on different areas of the energy business can be an asset to the investor. When end user demand is rising, which can tracked by monitoring both market prices (inventories/production) and rates of profitability for utility companies, there is the increased likelihood of an increase in development activity. When tanker rates are rising this suggests, regardless of energy prices, that demand is prompting an increase in supply, or extraneous circumstances threaten to constrict supply (the latest event being the bombing of a French oil tanker in Yemen – rates rose immediately afterwards).  Lastly, when pipeline capacity is high (rising) and terminal (storage) facilities are low this suggests that increased production activity is on the horizon.

There are limitations to these trains of thought – too many to list here. Nevertheless, within the energy industry rising tides typically float all boats.  Good news for midstream and downstream companies can presage good news for upstream companies.  This is somewhat of a different perspective than simply monitoring and pointing out what the price of oil is, what inventories are, and whether or not the U.S. will attack Iraq.

Part II  Tidewater Inc.  
 
Operations

By operating with an estimated 50/50 split between day and time charters, Tidewater’s utilization rates are prone to serious fluctuations. When demand for charters is strong and/or spot rates begin to creep higher, the company performs exceptionally well. However, when demand slows and/or spot rates begin to drop, the company’s performance fades. What is notable with Tidewater, however, is that the company has successfully negotiated fluctuations in market demand in the past while maintaining a tight balance sheet: it has historically funded new vessels with working capital, and long term debt remains next to nil.

Vessel Utilization

Taking an historical overview, as Tidewater’s worldwide utilization rates peaked in late 1997, so too did Tidewater’s stock price.

The one caveat to note when studying utilization rates is that Tidewater is increasingly relying on deepwater vessels for revenues (as a % of revenues deep water vessels were 4%, 6.9%, and 13.3% respectively for the years ended 2000, 2001, and 2002).  Deepwater vessel rates of utilization are historically (since 2000, or when the company first began tracking them) higher than overall rates.   This suggests that an evenly weighted calculation of utilization rates could skew the investor’s perspective.

Rig Counts

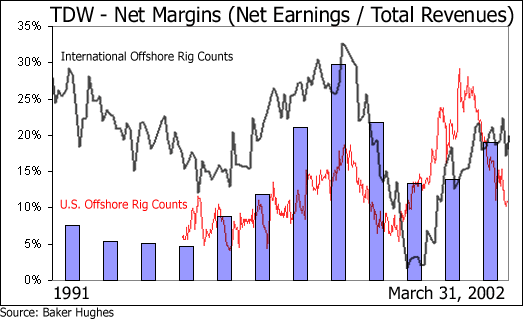
In order for the investor to forecast future rates of utilization they must look to marketshare and rig counts.  With Tidewater being one of the larger competitors, with an estimated 25% marketshare in the areas they serve (company estimate), it is logical to assume that the company will maintain its marketshare over smaller competitors based upon its pricing advantage.

As the above chart clearly shows, rising rig counts, regardless of utilization data, have a positive impact on Tidewater’s net margins. That said, what catches attention in the above chart is the difference in net margins from 1991 through 2002.  The chart shows that margin rates are positively correlated with rig counts. However, it also demonstrates that margin rates were maintained at double-digit levels even after rig counts begin to decline dramatically (1998-2000).

Upon an initial investigation, this would appear to be the result of economies of scale. After all, Tidewater has revenues nearly double that of the next closest North American traded competitor.  However, while Tidewater was quick to confirm that its solid business relationships and economies of scale were responsible for its increased margins, what we found upon further investigation is some accounting deceit (not really ‘deceit’ to the SEC but to the investor looking for a reason for increased margins). To be sure, by increasingly using non-expensed stock options to boost net earnings the company has raised margins higher than would otherwise be the case (we use the term ‘boost net earnings’ because this is what non expensed stock options can do).

TDW - Accounting For Stock Options

2002

2001

2000

1999

1998

1997


Net Earnings as Reported (Mil. $)

136,159

86,143

76,590

210,719

315,499

146,011

Pro forma (including stock options)

129,413

78,232

69,434

204,778

312,215

145,032

If Stock Options Were Expensed:

-4.95%

-9.18%

-9.34%

-2.82%

-1.04%

-0.67%

The company was flippant when confronted with our concerns relating to stock options issuance. They stated that they had no intention of incorporating stock options costs into their results, and added that the company didn’t abuse them. That the totals in 2000 and 2001 would have reduced earnings by nearly 10% each year, and that the only reason pro forma stock option expenses were down in 2002 was because of a falling share price, makes us skeptical that the company is not abusing options. At what point does the legitimate use of stock options translate into abuse? When earnings would be 15% lower?  20%?  30%?

Quite frankly, stock options issuance, which is a cost to businesses, would have increasing (except in 02) decreased net margins over the last 5-years.  Incidentally, it would be refreshing if a company were to actually state that ‘we don’t expense stock options because we don’t have to and they would negatively impact earnings.’ At least this would be the truth. 

Tidewater’s Competition

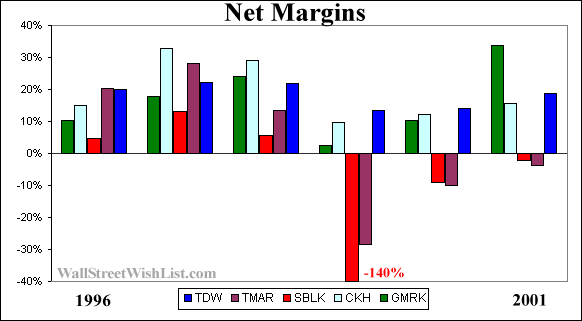
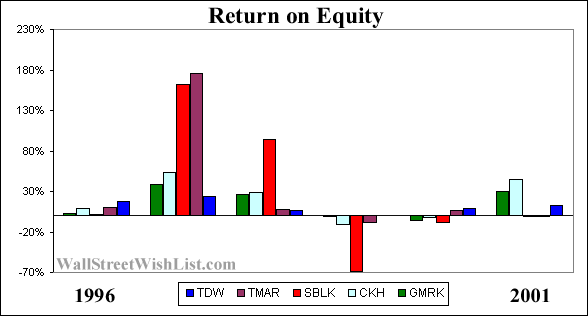
With the layout of utilization rates and rig counts in hand, consider next a breakdown of Tidewater against its major competitors. As is shown below, Tidewater is one of the most efficient companies insofar as basic net margins are concerned, and its historical returns on equity are stable.  Finally, and this is not shown below, the company pays a dividend. In sum, this basic comparison highlights Tidewater as the industry leader.

Tidewater – Year End Mar

2002

2001

2000

1999

1998

1997

Revenue

729

616.7

575

969

1100

690

Income After Taxes

136.2

86.1

76.6

210.7

243

138.2

Income as a % of Revenues

18.68%

13.96%

13.33%

21.74%

22.09%

20.02%

Current Assets

226.6

288.6

403.7

280.9

319.1

249.7

Current Debt

73.7

83.6

74.8

82.3

204.2

90

Current Assets/Current Debt

3.07

3.45

5.40

3.41

1.56

2.77

Total Assets

1700

1500

1400

1400

1500

1100

Total Debt

383.6

327.2

318.1

326.8

494.1

291.6

Total Equity

1316.4

1172.8

1081.9

1073.2

1005.9

808.4

Return on Equity

12.24%

8.40%

0.81%

6.69%

24.43%

17.90%

Cash From Operations

193.9

150.9

235.1

254.4

346.1

209.1

Trico Marine Services

2001

2000

1999

1998

1997

1996

Revenue

182.6

132.9

110.8

186.2

125.5

53.5

Income After Taxes

-6.9

-13.4

-31.6

25.3

35.3

10.9

Income as a % of Revenues

-3.78%

-10.08%

-28.52%

13.59%

28.13%

20.37%

Current Assets

73.9

59

35.3

43.1

48.9

19.7

Current Debt

30.7

30.2

36.8

33.7

41.1

9

Current Assets/Current Debt

2.41

1.95

0.96

1.28

1.19

2.19

Total Assets

655.7

678.1

730.6

768.9

698.8

144

Total Debt

300.7

320.7

393.5

402.5

359.4

21

Total Equity

355

357.4

337.1

366.4

339.4

123

Return on Equity

-0.67%

6.02%

-8.00%

7.96%

175.93%

17.90%

Cash From Operations

49.4

529

-13.7

85

66.8

15

Seabulk International

2001

2000

1999

1998

1997

1996

Revenue

346.7

320.5

342.2

404.8

210.3

109.4

Income After Taxes

-7.9

-29

-516.6

23.4

27.7

5.1

Income as a % of Revenues

-2.28%

-9.05%

-150.9%

5.78%

13.17%

4.66%

Current Assets

92.4

92.3

106.1

115.5

70.1

38.3

Current Debt

97.5

85.3

72.6

332.3

44.3

47

Current Assets/Current Debt

0.95

1.08

1.46

0.35

1.58

0.81

Total Assets

744.8

775.5

830.7

1400

603.8

274.5

Total Debt

513.4

540.7

576.2

593.1

188.3

115.8

Total Equity

231.4

234.8

254.5

806.9

415.5

158.7

Return on Equity

-1.45%

-7.74%

-68.46%

94.20%

161.81%

17.90%

Cash From Operations

66.8

26.3

17.5

90.9

40

22.6

Seacor Smit Inc.

2001

2000

1999

1998

1997

1996

Revenue

434.8

339.9

289.4

385.5

346.9

224.4

Income After Taxes

67.7

41.1

28.3

112.6

114.3

33.4

Income as a % of Revenues

15.57%

12.09%

9.78%

29.21%

32.95%

14.88%

Current Assets

291.5

322

282

311.7

296.1

201.5

Current Debt

113.7

66.4

49

71.7

59.5

29.3

Current Assets/Current Debt

2.56

4.85

5.76

4.35

4.98

6.88

Total Assets

1300

1100

1200

1300

1000

636.5

Total Debt

256.7

378

465.7

472.8

358.7

218.7

Total Equity

1043.3

722

734.3

827.2

641.3

417.8

Return on Equity

44.50%

-1.68%

-11.23%

28.99%

53.49%

17.90%

Cash From Operations

114.1

65.3

47.9

112.1

105.5

58.7

Gulfmark Offshore, Inc.

2001

2000

1999

1998

1997

1996

Revenue

112.1

77.7

72.3

86.2

46

34.7

Income After Taxes

37.9

7.9

1.9

20.8

8.2

3.6

Income as a % of Revenues

33.81%

10.17%

2.63%

24.13%

17.83%

10.37%

Current Assets

53.2

58.5

49.7

53.8

37

26.8

Current Debt

22

11.3

13.9

12.3

17.6

12.9

Current Assets/Current Debt

2.42

5.18

3.58

4.37

2.10

2.08

Total Assets

353.1

263.2

270.6

271.4

154.7

131.3

Total Debt

180.7

130.1

130.1

130.1

42.9

50.8

Total Equity

172.4

133.1

140.5

141.3

111.8

80.5

Return on Equity

29.53%

-5.27%

-0.57%

26.39%

38.88%

17.90%

Cash From Operations

133.4

97.6

104.7

108.5

85.3

62

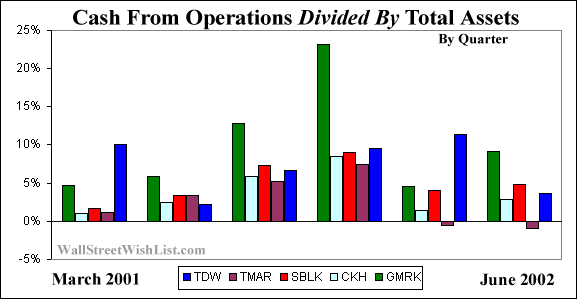
While net margins and ROE are traditionally popular measures to compare companies, another area to consider is how a company performs in relation to its assets.  TDW ranks second in this category -- or cash from operations divided by total assets. The much smaller GMRK aims to contract vessels on a long term basis, which is primarily why GMRK beats TDW in this area. Incidentally, GMRK is attractive for this very reason: more predictable business due to the company’s preference for longer term contracts.


TDW

TMAR

SBLK

CKH

GMRK

Cash From Operations/Total Assets
-- Average for last 6 Quarters

0.290%

0.105%

0.202%

0.148%

0.401%

Beyond the 4 direct competitors listed above, Tidewater is also in direct competition with Edison Chouest, a privately held company that deals primarily in deep water services, Maersk, the shipping ‘name’ of giant A.P. Moller, and Swire Pacific, a division of the Swire Group with annualized marine service revenues (including container services) of $893 million HK$. In the GOM Tidewater is in competition with the 4 listed companies (and Edison Chouest), while globally Maersk and Swire are competitors.

Conclusions

Tidewater is one of the strongest oil services companies.  Its conservative business approach and current vessel replenishment plans (which were enacted using primarily working capital and short term debt), suggest that its strength is not fleeting, but will remain a permanent fixture in the marine services industry. When combining the industry overview with a corporate overview the investor can surmise a possible investment recommendation.

Part III Investment Opinions

With falling utilization rates and overall weakness in day vessel rates, we believe that Tidewater’s stock price may have room to drop – this is an extremely near term consideration that takes into account TDW’s recent share price strength. 

Obviously, and because the entire industry is feast or famine oriented, we would prefer to purchase Tidewater shares when the trough both in valuations and operational results, is near. Not before.  We are concerned that current energy price trends are overstated because of Iraqi war fears, and prices could fall at any moment dependent upon developments in this area.   If prices fall the argument that rig counts should soon pick-up will likely crumble quickly, as will Tidewater’s stock price.  

Outlook

-- If the Financial Accounting Standard Board elects to have companies expense stock options, this could have a negative impact on Tidewater’s future earnings estimates. While Tidewater is quick to report that they list stock options in the footnotes, what they, and many other companies, do not consider is that analysts’ operational earnings estimates, which can move a stock price, do not include stock options. We believe that the Company should expense options before they are forced to. We expect developments on this matter, based upon FASB discussions and increasing investor pressure for financial clarity, within the next 6-18 months.

-- Given the current state of rig counts, utilization rates, and day vessel rates, Tidewater’s future earnings estimates are overstated. Unless rig counts soon rebound, which rising natural gas and oil prices have been suggesting would happen for some time, owning the stock could prove dangerous near term. However, given the volatile nature of marine services stocks, and the ‘herd like’ buying that can take place, if rig counts do soon rebound TDW may not again test its lows in the foreseeable future.

-- The company is not forecasting any goodwill impairment in 2002. However, they will be updating this outlook in the December 2002 results. Goodwill accounts for roughly 20% of total assets and 25% of net equity.

-- Not immune to absorbing competitors via takeovers, the company’s clean financial position and ability to leverage should enable TDW to acquire key competitors in the future.  The current new vessel plans are expected to be ongoing until 2005, and although the company has not directly made any claims, they seem to be focusing on larger more sophisticated deepwater vessels. This would be a natural goal given higher rates of utilization for these types of versatile vessels.

-- While currently the company is not at threat of reducing or suspending its dividend, developments mentioned above could impact dividends in the future.

Current Situation

Tidewater has a tangible book value of approximately $17.08 a share, the company has posted negative free cash flow in each of the last 4 quarters, and its forward earnings estimates have been in free fall for much of 2002. Based upon current industry weakness and the fact that goodwill increases will not occur in the future at the same pace as in the past, we do not believe that TDW will be able to maintain its historical (last 6 years) average of 10.6% growth in assets.  If the current situation deteriorates any further we would anticipate a halt to the company’s new vessel plans (as they temporarily did following 9/11) to preserve balance sheet strength and to continue making regular dividend payments.

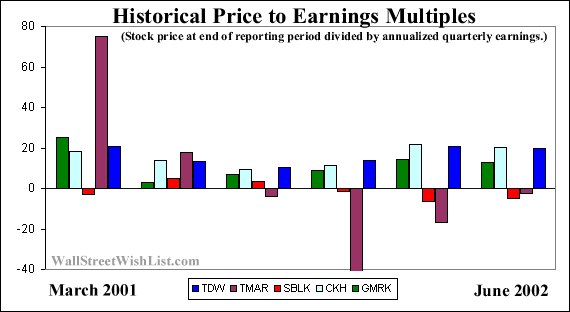
As for Tidewater’s dividend policy, we suspect that this, combined with TDW’s superior size, are the main reason why TDW’s shares typically trade with larger premiums than its competitors.  Using basic P/E’s, TDW is currently the richest company, and historically, although there are massive fluctuations, this is also the case.


TDW

TMAR

SBLK

CKH

GMRK

Average P/E Ratio last 5-Quarters (Annualized financial results)

16.52534

3.702224

NA

15.81269

11.77952

In sum, Tidewater is a well managed company that should survive any industry slowdown. We look to purchase TDW as a long term investment or, at minimum, reevaluate the company should its share price fall below $25 a share ($23.50 52-week low). TDW’s shares currently trade at $27.50.  Assuming TDW’s balance sheet remains clean the argument for corporate success with a pick up in the industry would hold firm. TDW has more room to operate than most of its competitors.

Another company we are monitoring is GMRK.   As previously stated, GMRK ranks first in cash from operations/total assets.  GMRK has 53 vessels and focuses its attention primarily on the North Sea. It also has a relatively clean balance sheet, and attempts to deal with long term contracts. GMRK does not pay a dividend.

Suffice it to say, we believe that TDW is the strongest company within the group and GMLK is a well run company playing a niche role. It is our belief that the industry trends are elusive, and the investor would be well served to maintain an extremely long term perspective. 


Sincerely,

Brady Willett & Todd Alway


Below is a list of some of the sources used to produce this report.  This is not a recommendation or advertisement for the services these sites provide.

http://www.simmonsco-intl.com/

http://www.tdw.com/

http://www.bakerhughes.com/investor/rig/rig_int.htm

http://www.seacormarine.com/

http://opg.oneoffshore.com/

http://www.tricomarine.com/

http://www.eia.doe.gov/

http://www.tricomarine.com/

http://www.energy.gov/

http://www.seabulkinternational.com/

http://www.oilnergy.com/

http://www.maersksealand.com/

http://db.petrodatasource.com/

http://www.gulfmark.com/

http://www.worldoil.com/

http://finance.yahoo.com/

http://research.stlouisfed.org/fred2/series/OILPRICE/downloaddata

http://www.wsrn.com/


http://www.merrilllynch.com/