| Log out |
|
|
|
|
September 4, 2006 |
||||||
|
Alcoa, AIG, AT&T, Citigroup, Coca-Cola, Dupont, General Electric, General Motors, Home Depot, IBM, Intel, Merck, Microsoft, Pfizer, Wal-Mart, and Verizon. Other than being Dow components what do these 16-companies have in common? Each is sporting a stock price that has done little or nothing over the last 5-years. In fact, if you purchased shares in the above stocks 5-years ago, you would be holding a loss on all but one today.*
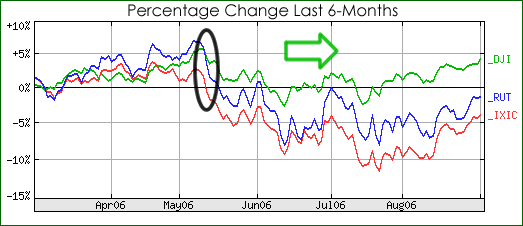
The above trend (Chart) has only just recently started to reverse. Can The Big-Caps Hold The Lead? In May 2006 volatility erupted in the financial markets and investors began to speculate about a hard landing in the US economy. Risk-averse investors started to shift money into larger-cap stocks.
With tech stocks losing their leadership (MSFT, DELL, INTC, etc.) and the average P/E multiple on the Russell 2000 estimated by Bloomberg to be above 30 (compared to a 18 multiple on the Dow), the change in leadership that started in May made sense. In a word YES the big-caps can continue to lead for some time. Equity Leaders Can Be Return Laggards While basic valuations suggest that large-cap stocks are one of the most attractive areas of the marketplace, it should nonetheless be pointed out that outperforming other types of stocks doesnt necessarily translate into positive performance. Quite frankly, the Dow 30 or the Global Titans Index (50 largest multinationals) could decline by 5% in the coming 12-months and small-caps could decline by say 10%. To those that base their performance in comparison to other sector pickers, owning money losing large-caps under such a scenario would be deemed a success. Which brings us to why large-caps could fall even as they attract greater investor attention than small-caps: key market leaders have turned flat and it may take a perfect soft landing in the global economy for them to get pumped up again. The Dow Component To Watch In 2002 - following a 5-year decline in net income - Caterpillar claimed it was no longer a victim of the same business cycle of the past. So far so good: In July Caterpillar beat estimates, raised its guidance for the year, and raised its dividend. Given that competitor Kamatsu has also raised its growth projections, and that there is little concrete information to suggest that investment in construction and mining is crashing, now must be a good time to buy shares is CAT, right? Wrong. In a recent Citigroup survey 208 equipment dealers from 41 countries said that growth rates, while strong, are starting to moderate, farm equipment makers are reporting declining demand, and the US housing market is falling faster than most had expected. While hardly concrete, there is enough reason to believe the best of times for CAT are drawing near a close. What About The Cyclical/Secular Debate? One of the reasons why history may regard todays bull market as a cyclical bull instead of secular bull is because the Dow the worlds leading stock index has failed to reach a new high in more than 6-years. As trivial as it may seem, bull markets are celebrated as such not because of market gains, but by the toppling of all-time highs. Pay no attention to the Russell 2000 and other less notable indices. Rather, until the major US markets reach record highs no rally will ever be strong enough terminate the secular bear crowd. Another reason why the secular bear viewpoint is appealing is because, according to Barrons, Street strategists currently rank health care stocks as being the most popular sector. When was the last time healthcare stocks led a major bull market charge? Never is the correct answer. Then there is utility stocks, which are trading at record highs and paying, on average, an extremely unattractive (div) yield compared to bonds. When was the last utility stocks led a major bull market charge? Again, never is the right answer. These viewpoints are not being made in an attempt to dismiss the performance of healthcare and utility stocks. On the contrary, taking dividends into account utilities have produced stronger long-term returns than technology stocks, and health care stocks have proven to be exceptionally attractive compared to other sectors during recessionary times. But this is exactly the point: if the US markets are in a sustainable long-term bull market why are granny stocks and health care companies outperforming? Does it have anything to do with the fact that the secular bear is about to reassert itself? Conclusions While the Dow (and larger cap stocks) could continue to benefit from rotational trends in the marketplace, one company, Caterpillar, has yet to signal that the index is about to embark upon a record rally attempt. If the global economy is still thriving Caterpillar, which generates more than 50% of its revenues overseas, must bounce. CAT is currently trying, and thus far failing, to bounce off of its 200-DMA. Another potential market negative is that defensive stocks are attracting more investor attention. The last time utilities stocks performed as strongly compared to the Wilshire 5000 as today was (for a brief period) in late 2001. And yes, the Wilshire 5000 peaked in early May.
The study of market leadership trends is not the gospel when it comes to forecasting long-term trends in the US economy and financial markets. Even so, if you listen closely enough to what the leaders and laggards are saying you can sometimes glean information from the whispers of sages. One such voice can be heard today. What is it saying? That the very notion of Caterpillar using business savvy to repeal its fundamental reliance on business cycle spending trends is ludicrous. To note: Although Caterpillar is up by 16.4% year-to-date, its share price has fallen sharply in recent months while the Dow has held firm. Should this trend continue it would, eventually, spell serious trouble for the bull.
* As for hand selecting 16-Dow components that have done very little over the last 5-years, this is misleading information. Citigroup shares are actually up by 6.9% since September 4, 2001 (or an average of 1.38% a year before dividends). Just think, if Citigroup can rally by another 19.6% they will be back to the record high levels attained 6-years ago. Lets see 19.6% divided by 1.38% equals in 14-years Citigroup will be breaking all-time highs! Suffice to say, when an analyst starts to excitedly throw around the term bull market, listening closely to what the market leaders and laggards are saying can help you acquire a better understanding of the marketplace. In late May it was reasoned that Something was unleashed on May 11, but as yet we cannot be sure exactly what. The music of the market continues to chime that May 2006 marked the cyclical bull market peak. Welcome to September. |
||||||
