Spotlight September 19, 2002
Will 30 bloated companies with a combined market cap of $2.6 Trillion really be able to grow earning by an average of 11.6% over the next 5-years?
By Brady Willett & Todd Alway
The main problem with consensus Wall Street earnings estimates is that they are based upon ‘operational results’. Such earnings results ignore pesky ‘1-time’ charges that corporate executives regularly delegate to the footnotes in 10Qs mailed to the SEC well after reporting season has passed by.
Even so, based upon operational results the expectations analysts have priced in for the Dow 30 are ludicrous. To be sure, over the last 5 years the average Dow component has grown operational earnings, as opposed to actual ‘reported earnings’, by an average of 3.8% per annum (or roughly in line with S&P 500 operational totals of 4.1% per annum - estimating $48.73 for year-end 2002)*. By contrast, analysts expect that during the next 5-years the Dow will, on average, grow operational results by a blistering 11.6%. Judging from the discrepancy between yesterday’s earnings results and what is anticipated to arrive tomorrow, one would assume that the last 5-years serve as some record shattering depression in earnings. Has this really been the case?
|
The precursor comment to calling analyst estimates insane is that many of the Dow 30 companies have a global reach. Thus, if another alternative engine of growth were to emerge, unlikely as that may seem, higher levels of earnings growth could be attained. However, with global stock markets, not just American exchanges, floundering and no economy close to comparable with the American, such a transition phase can hardly be assured and/or forecasted to occur during the next 5-years.
All may not be lost. After all, as the actual reporting season draws near and analysts trim their expectations the gap narrows. In fact, First Call’s Chuck Hill states that 2Q02 ‘was one of the rare occasions of late when the final results essentially matched analyst expectations at the beginning of the quarter.’
Nevertheless, it is the longer-term analyst expectations that appear to be completely erroneous time and time again. This was the case when the bull market began (1983-1985) when analyst (Value Line) estimates were more than double the actual results, and this was also the case in 2Q02. To be sure, while Mr. Hill applauds the fact that analyst estimates for 2Q02 were at +1.6% when the quarter began and actual results came in at +1.4%, what he neglects to mention is that estimates in 2Q01 for 2Q02 stood at nearly +30%. Moreover, even as 2002 began analysts still suspected a nearly 9% improvement in 2Q02 results. Point being, analysts may expect Dow companies to average 11.4% earnings growth over the next 5-years – and this is undoubtedly why many investment models portend that stocks are undervalued. But as time goes on ‘normal trimming’ will take place, the expectation for future growth will be pushed back further and further, and further….
The Dow is trading at 23 times trailing operational results. Before the bull market began in 1982 only 6 Dow components traded with double digit P/Es and the overall average (1980) was below 8. In sum, ridiculous long-term growth estimates, even though they have been proven wrong time and time again, are one of the only reasons why near record highs in trailing P/Es are possible. Things are always improving – better times lie ahead – the worst is truly over.
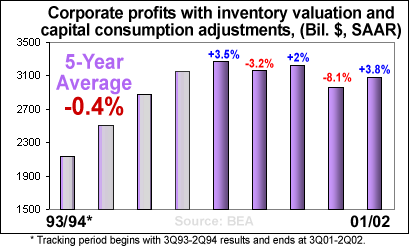
* Whereas ‘operational results’ for the S&P 500 have grown on average by 4.1% over the last 5-years, ‘as reported’ results have grown by only 1.8%. Furthermore, adjusted corporate profit data from the BEA (chart) shows that corporate earning (total) have actually declined on average by 0.4% over the last 5-years.
 |
All data and information within these pages is thought to be taken from reliable sources but there is no guarantee as such. All opinions expressed on this site are opinions and should not be regarded as investment advice.
Copyright © 2000, 2001, 2002
FallStreet.com