October 4, 2002
VIX Trends May Presage Market Crash
There are many theories on why the stock markets have been unable to sustain a rally. To be sure, some analysts say the threat of war with Iraq has stymied investor confidence, others argue that the daily deluge of corporate scandals continues to fuel investor anxieties, and still others point to weak corporate earnings and the soft U.S. economy as the primary reasons for stock market woes.
The best word to describe mania purchases of equities in the 1990s is ‘greed’. By contrast, the most applicable word to describe today’s market malaise, albeit a vague word at that, is ‘fear’. Such is why most theories on the stock markets, excluding those that focus on corporate earnings, fail miserably – they can not quantify the words ‘greed’ and ‘fear’.
The Need for a Washout
Investors have been brainwashed into the idea that the markets must ‘capitulate’ before prices head higher. And while this theory carries with it much precedent, what it fails to do is pinpoint exactly when capitulation takes place and/or how the investor can best take advantage of the situation. For certain, what most glamorized capitulation theories do is assume everyone is buying at the bottom and selling at the top. As the Japan experience aptly demonstrates, in a down market this equates to a plethora of timely buying and selling – the threat of losing a great deal of capital is the only constant.
Nevertheless, be it with the gold market or any other hot/cold commodity, the idea that the markets must shake out weak hands before prices rise is a generally accepted premise among futures traders. As such, tracking the trends in the CBOE volatility index is a popular pursuit, as it tends to track the temperature of investor sentiment.
 |
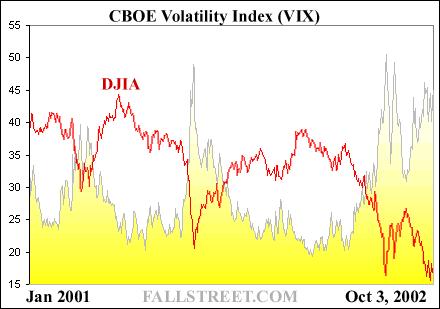
What the VIX is telling investors right now is one of two things:
1) The markets have already capitulated (the new bottom!)
2) The markets have not capitulated (the VIX has not declined!)
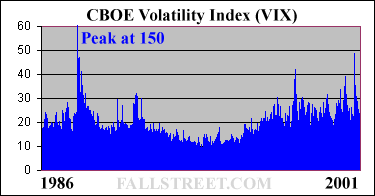
Granted, these tell tale signs are exact opposites, and one must end up being right by default. However, what the VIX is also telling us is that volatility is stuck near historical highs. For certain, a reading of 40+, which is typically very rare and often times is a signal of ‘capitulation’, has become a common reading today.
 |
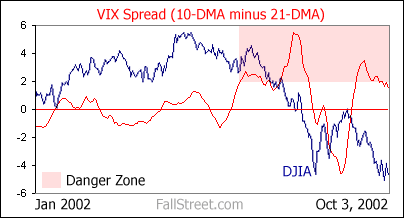
Another reading worth looking at is the VIX moving averages: the important signal being when the 10-DMA crosses the 21-DMA.
 |
This method of tracking the VIX has proven an extremely accurate gauge of the markets direction in recent months. To be sure, ever since the differential between the 10 and 21-DMA’s broke above 2 the markets have been crashing. Furthermore, the ‘bottom’ in the markets, and the subsequent bear bounce, arrived the moment the spread broke below 0, and the most recent top in the markets arrived moments after the spread put in a new yearly low.
 |
Conclusions
When the VIX is drifting below 20 investors are thought to be complacent - one might even say ‘greedy’. By contrast, when the VIX is rapidly rising this is usually evidence of building investor apprehensions – one might also say ‘fear’.
With this in mind, what does a VIX that is hovering around 35-45 for months on end indicate? Well, considering it has never happened before one can not be certain. Perhaps it means that we are in a lengthy and orderly ‘capitulation’ phase? (pardon the contradiction) Or perhaps it means that something very ominous is brewing?
In sum, one thing is for certain: until the VIX begins to decline there remains the threat that capitulation has not occurred – that the VIX could still be readying to head even higher. Yes, volatility begets volatility, and the truth is that fear and greed are unquantifiable. Nevertheless, expelling fear from today’s marketplace is proving to be difficult, and the longer it takes the greater the risks are. Remember, a stagnating stock market with historically high VIX readings is not a rarity – it is a first.
|
|
All data and information within these pages is thought to be taken from reliable sources but there is no guarantee as such. All opinions expressed on this site are opinions and should not be regarded as investment advice.
Copyright © 2000, 2001, 2002
FallStreet.com