October 23, 2002 -  3:00 PM
Strolling Through the Gold Patch

Yesterday’s 5.79% rally in the Philadelphia Gold index notwithstanding, gold stocks have taken a hit since mid-September: a 17.4% hit since September 16 to be exact, based upon the closing price of the XAU Index.  As such, and considering that most are quick to note that gold has support at $310 an ounce, the investor cannot help but be interested in whether or not opportunities lurk.

That said, a basic overview of gold stocks quickly leaves the investor disappointed. For certain, and while most companies have plunged from recent highs, all share prices are still well above their 52-week lows. Furthermore, most companies that have what we consider to be a clear outlook with regards to earnings and production (revenue streams), Meridian, Goldcorp, and Royal Gold, are trading at levels one would think was reserved for bio(tech) companies, or stocks which investors mostly gamble on.  Granted, low cost producer Meridian may run across a vein tomorrow that yields unimaginable mining returns. However, if they don’t the company is trading at 32 times next years earnings – this for a company with a weak reserve base.

ROE

Company

Sym

High

Low

For P/E


59.8

AngloGold Limited (ADR)

AU

-28.7%

60.7%

13.29

55.3

Royal Gold, Inc.

RGLD

-17.8%

224.0%

43.79

52.4

Randgold Resources Ltd.

RRUS

-12.9%

45.7%

7.69

45.3

Golden Star Resources Ltd

GSS

-47.9%

157.1%

9.69

39.5

Richmont Mines Inc.

RIC

-30.2%

283.8%

NA

30

Meridian Gold Inc.

MDG

-19.7%

95.0%

32.88

29

Harmony Gold Mining Co.

HGMCY

-32.8%

158.3%

10.3 (Jun 03)

27.1

Goldcorp, Inc.

GG

-20.0%

92.8%

24.1

15.3

Ashanti Goldfields Co.

ASL

-19.1%

67.0%

9.23

14.3

Compania de Minas Buenave

BVN

-33.3%

20.2%

11.05

9

Glamis Gold Ltd.

GLG

-22.5%

169.2%

47.82

9

Lihir Gold Limited (ADR)

LIHRY

-34.3%

22.9%

50.2

8.6

Anglo American PLC (ADR)

AAUK

-30.7%

25.3%

10.29

3.2

Newmont Mining Corporatio

NEM

-23.7%

35.0%

32.05

1.9

Barrick Gold Corp.

ABX

-36.7%

10.5%

32.33

0.8

Miramar Mining Corporatio

MNG

-45.1%

104.9%

NA

-1.2

Agnico-Eagle Mines Ltd.

AEM

-25.0%

56.9%

32.9

-2.8

Bema Gold Corporation

BGO

-50.5%

216.7%

10.56

-5.8

Apex Silver Mines Limited

SIL

-26.3%

71.7%

NA

-6.9

Placer Dome Inc.

PDG

-41.0%

10.1%

20.26

-8.6

Cambior, Inc.

CBJ

-55.3%

95.1%

16

-9.1

Pan American Silver Corp.

PAAS

-43.2%

86.3%

35

-9.9

Gold Fields Limited (ADR)

GFI

-37.6%

148.8%

18.4 (Jun 04)

-9.9

Crystallex International

KRY

-35.5%

103.7%

41.25

-10.6

Silver Standard Resources

SSRI

-53.8%

103.8%

NA

-11.1

Echo Bay Mines Ltd.

ECO

-38.1%

72.0%

43

-11.2

Hecla Mining Company

HL

-43.7%

331.2%

12.77

-11.3

Pacific Rim Mining Corp.

PMU

-61.6%

46.2%

NA

-13.7

Kinross Gold Corporation

KGC

-42.8%

167.7%

NA

-18.7

Canyon Resources Corp.

CAU

-41.2%

81.1%

NA

-24.3

Vista Gold Corp.

VGZ

-70.0%

213.0%

NA

-75.3

TVX Gold, Inc.

TVX

-37.5%

185.4%

39.11

-178.4

Coeur d'Alene Mines Corp.

CDE

-43.6%

116.9%

28.2

NA

Durban Roodepoort Deep Lt

DROOY

-43.5%

204.6%

NA

NA

Randgold & Exploration Co

RANGY

-49.0%

70.0%

NA

Legend

ROE: Return on equity

High: % Decline from 52-week high

Low: Current share price from 52-low (based as %)

For P/E: Consensus price-to-earnings average (next year)

As the companies with negative ROE aptly point out, as a whole the industry has yet to benefit from an uptick in metal prices.  Moreover, in the case of Barrick, the company has actually faired worse than they did in previous years due to mining complications and the demise of their once superior hedge book.  Point being, gold has been above $300 an ounce for much of 2002, but the first two quarters of operations in 2002 have not washed over weakness from 3Q01 and 4Q01 (ROE is based upon, in most instances, the last 4 quarters ending June 02).

Suffice it to say, we do not feel that undervaluation is apparent within the gold sector.  This is based upon not only the above stats, but on our belief that the investor should look to purchase companies that are undervalued based upon earnings calculated using the current price of gold, not its expected future price. And while certain companies trading at seemingly respectable forward P/E levels may warrant further investigation, something we are taking a closer look at (ASL and BGO), those companies that offer the investor predictability both in earnings and production are trading at extremely high valuation thresholds.

The conclusion to be made is that notable undervaluation is unlikely to appear in the group unless the POG retraces below $310 an ounce, or, worst case scenario, below $300 an ounce. If gold were to succumb to selling pressures and break below $300 an ounce, no doubt an update of the above chart would see many companies trading near 52-week lows, and forward P/E estimates would be in single digits.

Gold as a Hedge
Gold stocks have served as a respectable hedge since the bear market began.  To be sure, since January 2000 the S&P 500 is down by roughly 40% while the XAU index has lost only 7%. And while losing 7% may not seem like much of hedge, it is worth noting that the XAU tracks the likes of Barrick, Placer Dome, and Freeport, or companies that historically hedge production or have interest in non-gold related activities. By contrast, the Gold BUGS index, which is a collection of unhedged gold producers, is up by roughly 50% since January 2000.

With gold unable to trade above and/or sustain $330 an ounce, gold stocks have been left to trace the broader equity markets: during the late July sell off in equities gold stocks did not offer the investor a refuge from stock market woes.  Furthermore, gold shares were not the place to be during the September/October sell off in stocks.  Rather, and this has been the case ever since the massive rally in May 2002, gold stocks have simply traced broader equity strength and weakness. 


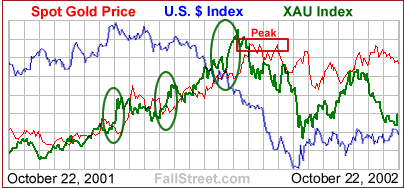
For steadfast doomsayer gold companies provide a degree of security. To be sure, if the U.S. dollar were to decline sharply the POG would likely benefit – this type of ‘safe haven’ hedge is exactly why the POG has benefited in 2002, and likewise why gold stocks have performed well.  Nevertheless, remember also that gold stocks have performed strongly in 2002 based largely upon expectations of future jump higher in the POG. If an increase in the POG does not materialize, perhaps also if prices were to simply remain flat, gold stocks would likely decline.

As the chart below demonstrates, the U.S. dollar is weaker year-over-year and the POG is stronger.  Note also that gold stocks (XAU) previously rallied ahead of each rally in the POG: the psychology was that so long as gold stocks had jump the POG of gold would continue to escalate and vice versa. Suffice it to say, as gold stocks have dropped investor excitement has diminished.  Now gold stock rallies are dependent upon broader equity market strength and weakness, and the POG has, baring the odd rally for JPM default fears, done little since its peak.

In sum, in order for investor excitement to reenter gold stocks there will have to be another run-up in the POG and/or an external event (i.e. terrorism, corporate blow-up, double dip fears, etc.) Notice the difference in investor  psychology: the XAU index was at 89 yesterday (gold was strong at $312), and the XAU is at 62 today (gold is weak at $312)…


Meridian Gold
Former Wish List company, Meridian Gold, announced 10 cents in 3Q02 earnings yesterday, and the company is currently expected to earn 51 cents/share next year.  During the first 3 quarters of 2002 Meridian produced 249,728 ounces of gold at an average selling price of $311 an ounce versus 229,670 in 2001 at an average realized gold price $277 per ounce. Net earnings were up by 17% year-over-year, while the company’s realized selling price of gold was up 12%.

Tidewater
Tidewater beat downgraded quarterly estimates by a penny yesterday. However, this number included roughly 4 cents from 3 vessel sales during the quarter, of which 2 cents arrived from an extremely timely vessel sale on September 30.  A better gauge of the Tidewater’s activities can be seen in vessel revenues, which were flat compared to the quarter ended June 02 and down 16% year-over-year.

Tidewater remains confident that offshore rig activity is near a bottom, but scant evidence currently supports this belief. During TDW’s call the company stated that they have roughly $200 million still owing on 32 vessels currently under construction (worth $500 million). 

BWillett@fallstreet.com

All data and information within these pages is thought to be taken from reliable sources but there is no guarantee as such. All opinions expressed on this site are opinions and should not be regarded as investment advice.
Copyright © 2000, 2001, 2002
FallStreet.com