June 13, 2003
Excitement In Tech Peaked Last Week
With the Nasdaq closing higher in each of the last 3 sessions there would seem to be cause for tech investors to celebrate. However, last weeks intraweek high on the Nasdaq of 1684.06 (struck in Friday June 6) has not been beaten this week. Furthermore, Nasdaq trading volume has been below its 30-day average for each of the last 4 sessions. Suffice it to say, a seemingly bullish week for tech investors could be cause for alarm.
The Story of Volume
Volume is not always a reliable indicator of the markets direction. However the basic trend is that escalating volume means rising stock prices (except in ‘washouts’ or severe sell offs, wherein volume often spikes higher in dramatic fashion).
|
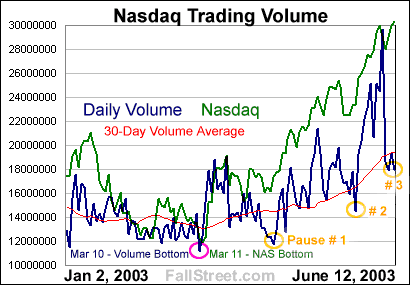
Historically investors make outsized purchases of mutual funds in the month of January. However, this year – and for the first time in more than a decade – money actually left funds in January. The logical assumption to be made at the time was that investors were finally giving up on stocks. However, in hindsight, it turned out that investors were simply waiting for the Iraq situation to clear up. Once Iraq was attacked money began to move into stock funds, and the Nasdaq began to jump higher.
 |
Although the initial surge in Nasdaq volume failed to hold, by mid-April another surge had began (after pause #1). This steady surge in trading volume – which given the short positions beforehand was undoubtedly fueled in large part by covering – paused briefly on options expiration day in May (May 23). However, pause #2 was exceptionally brief: volume has exploded higher since up until nearly 3 billion shares traded hands on the Nasdaq last Friday (June 6).
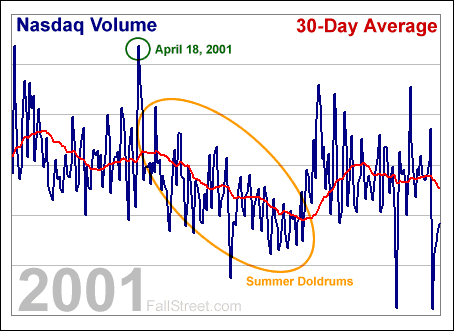
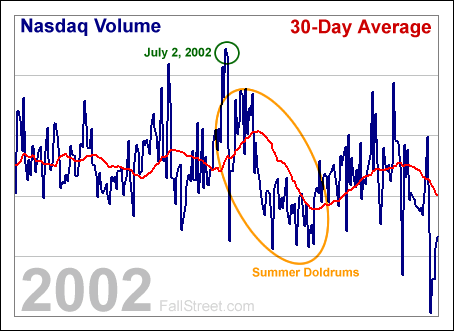
The reason why this weeks action in tech stocks (pause #3) may be noteworthy is because we are near what is seasonally referred to as the ‘summer doldrums’. Put simply, the summer doldrums are when trading volume begins to fade as summer heats up. This reoccurring phenomenon is typically explained by the fact that traders/investors tend to take their vacations in July/August and return to work/investing in September. However, and thanks also to loosely scientific mantras such as ‘sell in May and then go away’, the ‘doldrums’ can become a self reinforcing occurrence at any given moment: the doldrums can begin as early as May or as late as August.
In short, and almost without exception, there is a volume lag in the markets leading into September. Very seldom do terrific stock market rallies occur during these lags.
 |
 |
If last weeks nearly 3 billion shares traded ends up marking the volume peak before the doldrums arrive, the likelihood is that tech stocks will continue to become a less exciting area of the marketplace until September/October rolls around. This doesn’t necessarily mean that tech is doomed to collapse at any moment. Rather, that the pace of any possible advance is not likely be as strong as the rally was from pause #2 to pause #3 (a rally that was clearly, in hindsight, fueled by a seasonal/short covering explosion in volume).
VXN Bottoms as Volume Tops
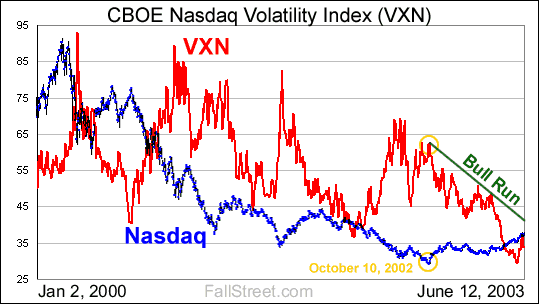
When combining volume considerations with recent action in the VXN, this could be a signal that tech has topped. Like volume, the VXN is not an absolute indicator. Nevertheless, low readings in the VXN/VIX can be an indicator of increased investor complacency (something that is obviously more prevalent today than in mid-March). The story goes that extreme readings in investor complacency can mark turning points in the markets – or as investors become more complacent the odds of them turning cautious increases.
To note: while worthy of mention, extremely low readings in the VXN/VIX have not always translated into immediate stock market setbacks.

All data and information within these pages is thought to be taken from reliable sources but there is no guarantee as such. All opinions expressed on this site are opinions and should not be regarded as investment advice.
Copyright © 2000-2003. FallStreet.com