January 3, 2003
No Bull: Volatile Markets Mean Bears Not Hibernating
In early 2000 I speculated that when the bear market arrived market volatility would subside. This conclusion was based upon the notion that during previous bear markets volatility peaked during the bearish ‘washout’ periods, but soon afterwards the markets always reverted to period of calm trade. As it turned out, my speculations were untimely. To be sure, as the current bear market drags on volatility is actually increasing.
|
|||||||||||||||||||||||||||||||||||||||||||||||||||||||||||||||||
To put this data into context, consider that last comparable bearish ‘washout’ period in the mid-1970s: immediately following the 1974 plunge the markets the markets became less volatile.
|
|||||||||||||||||||||||||||||||||||||||||||||
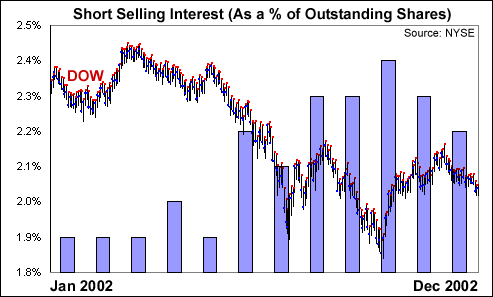
There are numerous reasons why market volatility is on the rise even as investor interest in stocks is in decline. For starters, short interest has been steadily escalating since the bear market began: higher short interest in stocks can turn what would otherwise be small rebound rallies into a large, erratic price spikes.

Furthermore, turnover rates continue to escalate with each passing year, and with each passing decade: from 12% in 1960 to more than 100% (for the first time ever) in 2002. On a related note, program trades have also been increasing during the bear market. Nevertheless, that market volatility continues to increase after 3 terrible years for stocks is rare.
Is This The Most Volatile Market Ever?
Many people, myself included, are quick to call the current market one of the most volatile ever. However, one market was more volatile using the up/down reading. You guessed it: 1929.
During 1929-1932, which is one of the greatest bear markets on record, the up/down measure of market volatility didn’t peak until 1932, or when the average daily move on the Dow (*including Saturdays) was more than 2%. Keep in mind also, that following 1932, which was the fourth down year in a row for the Dow, volatility began to vanish.
|
|||||||||||||||||||||||||||||||||||||||||||||
The lesson, though largely anecdotal, is that every bear market has a ‘washout’ period and, without exception, following each washout period trade becomes calmer than it was before the washout arrived. And while trying to invest based upon long-term volatility trends is hardly an exact science, the fact remains that since no washout period has become a matter of historical record during the current bear market, investors should be on guard: no memorable bull market ever began when volatility was on the rise…
|
|
All data and information within these pages is thought to be taken from reliable sources but there is no guarantee as such. All opinions expressed on this site are opinions and should not be regarded as investment advice.
Copyright © 2000, 2001, 2002
FallStreet.com