| Log out |
|
|
|
 |
||||||||
|
February 4, 2005 |
||||||||
|
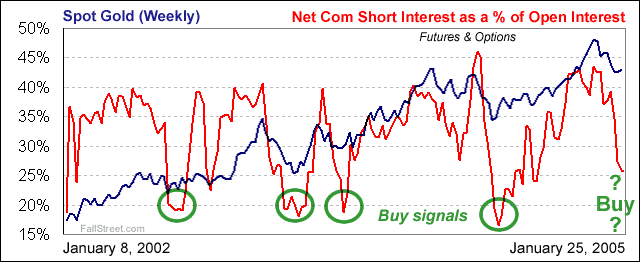
As the above chart suggests, when the commercials are aggressively adding to their net short position gold is drawing closer to a top, and when the net short commercial position is in control of less of the market gold is closer to a bottom. What is worth remembering is that the buy/sell signals that have worked since 2002 may not continue to work in 2005 and beyond. Indeed, the net commercial short position (since 1995) has only been giving accurate buy/sell signals using the net com short interest as a percentage of open interest numbers since late 2001.
Today’s COT data (current as of Feb 1) confirmed that the commercials covered more of their short bets. Furthermore, and following this week’s gold price collapse, the data due out next week should show even more commercial covering. The statistics tell us – again, during the latest gold bull market - that when the com shorts are covering as rapidly as they are today, a gold bottom is imminent. Below is the top chart updated, current as of February 1, 2005, with a forecast of what next weeks chart could look like.
It is important to remember that the COT bull market indicators will eventually fail (i.e. either the commercials will default or make so much money beating gold down that they will have little choice but to go net long again). As such, although gold is clearly nearing another buy target (April gold closed today at $415.90 and gold’s 200 DMA is around $412), it is only a buy if the bull market is set to continue. Will the gold bull market continue? I think it will, regardless of whether or not the IMF sells gold or how many dollar pleasing speeches Greenspan gives. However, I don’t see any near-term reason (beyond COT) to speculate that gold’s 200 DMA is rock bottom resistance. Rather, any further selling could bring $400 an ounce back into focus. |
||||||||