December 10, 2003
Final Dow 10,000 Party May Be Decades Away
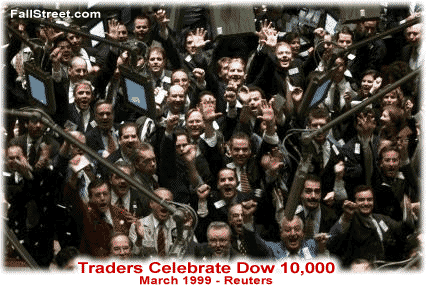
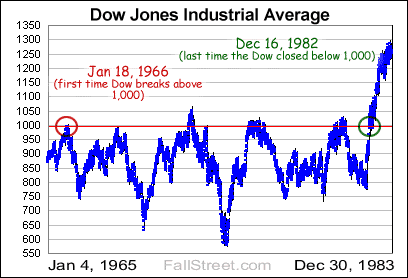
On January 18, 1966 the Dow Jones Industrial Average briefly eclipsed the 1,000 mark for the first time. Given that so many years have passed by, and that compared to nowadays stock ownership in 1966 was only for the chosen few, pictures of this historic event are difficult to come by. Nevertheless, a recent photo – of traders cheering Dow 10,000 for the first time – is undoubtedly similar to the scene on the NYSE trading floor some 36+ years ago.
 |
Soon after the Dow’s first attempt at 1,000, the U.S. stock markets entered a volatile decade – popularly coined the stagflation 70s – and each subsequent attempt at 1,000 was set to dwindling fanfare (or so it can be assumed). Then, in late 1982, with the Dow trading at near record low valuation levels and the public interest in stocks that developed in the early 1970s bull all but expired, the U.S. markets would enter an impressive multi-decade bull run. For those keeping score, it took the Dow nearly 16-years after its first attempt finally slay 1,000 for good.
 |
Today the Dow is nudging up against 10,000 and opinions vary as to what, if anything, this means. There is no magical lesson to be learned when studying history; no patently correct conclusion to say when 10,000 will finally be broken. Nevertheless, what made Dow 1,000 a difficult nut to crack is exactly what is making Dow 10,000 a formidable long-term resistance level today: OVERVALUATION.
Yes, stocks are in what could be a seasonally strong upswing, and with the Fed promising to keep rates at 45-year lows this could certainly compel more fixed income players to jump into the equity arena. Quite frankly, the odds are increasing that Dow 10,000 will be broken to the upside in the coming weeks/months…
However, until U.S. stocks become undervalued – better yet, until thoughts of undervaluation begin to focus on more than interest rates and unsustainable growth bursts – the Dow is not likely to wave good-bye to 10,000 for some time.
With this in mind, one cannot help but remember the Nikkei in the late 1980s topping 30,000 and giving 40,000 a run…two decades after its first assault at 10,000 the Nikkei is, once again, battling at 10K. And while you would be hard pressed to find a Nikkei or Dow speculator today that isn’t at least aware of the potential psychological importance of 10K, it is equally difficult to assume that the final 10,000 party is upon us. After all, the vague lesson of history – judging by the single digit P/Es and dull celebration that greeted Dow 1,000 in late 1982 – is that Dow 9,000 will only become a memory when the great bull market is talked about retrospectively.
In short, bull markets do not end with the mere utterance of the word abracadabra. Rather, bulls end when people that should never have been the markets in the first place leave. Despite claims of a great bear, this has not happened yet.
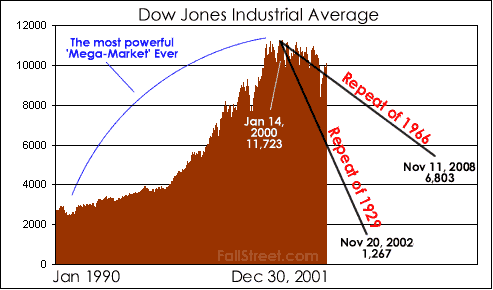
With a 1929 type crash moving out of the picture, a 1966 style methodical meltdown comes into focus. A chart, revisted, suggets that if history repeats itself Dow 10,000 will not arrive before ‘new lows’ are tested. Given that the 1982-2000 bull was the longest on record, and that valuations today remain rich by historical standards, you could speculate that the fallout will last a little bit longer than the stagnate 1966-1982 period. Perhaps two decades...

a